


 Our value rated atmospheric RAD anomalies are indicators of
hydrocarbons at some unspecified depth. These anomalies may be
associated with the targeted geologic zones or they may be sourced
from another formation that has thus far been overlooked or ignored
completely. It is the interpreter’s responsibility to try and
determine a logical source for the RAD anomaly. (see Fig. 1)
Most 3-D surveys are shot to obtain data over a known target, a
producing formation, an exploration discovery or a specific
exploration objective. Of course, the seismic data covers a much
thicker geologic section than just the targeted zone(s). How many
times have we logged unexpected pay zone(s) while drilling to the
main objectives?
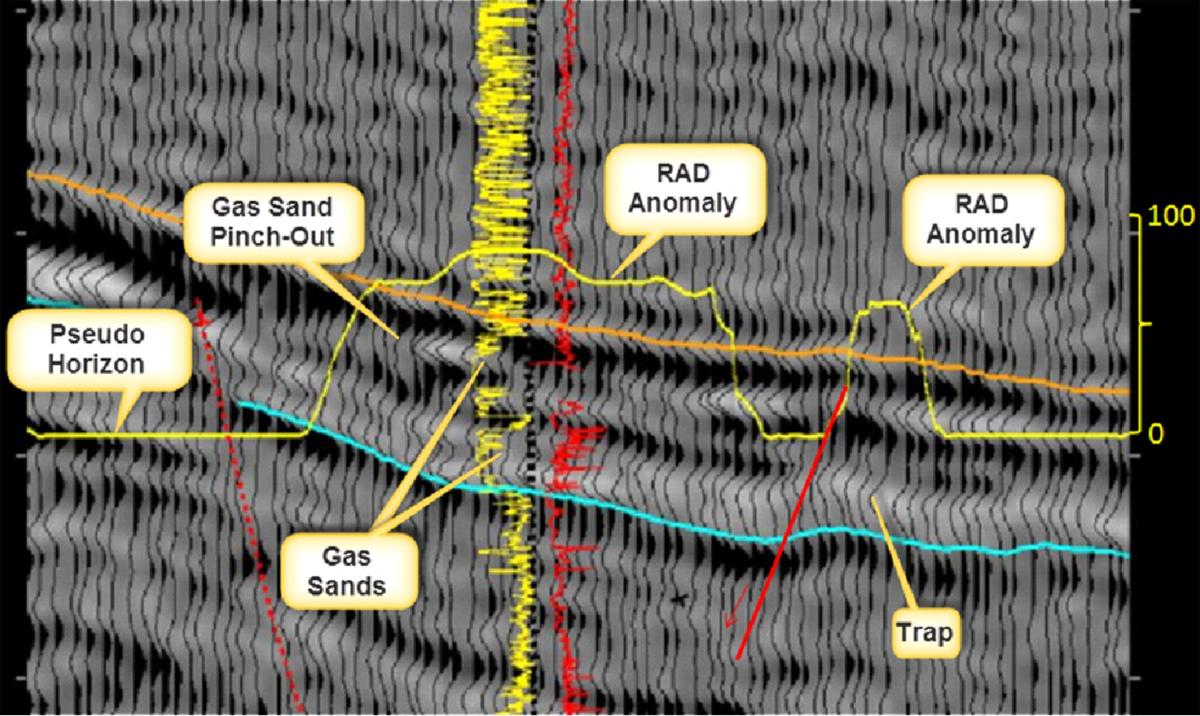
One method that is found to work for some entails the importation
of the RAD data, as grids, into the seismic 3-D interpretation
package. One geophysicist’s method is to scale the data to
something like 0-100 then convert it to a pseudo horizon. Display
the pseudo horizon on your seismic section, it will show up at zero
time. So if your target zone is at 2 seconds add 2000 to your horizon
and it will now show up at 2 seconds on the seismic line. The RAD
anomaly will then be shown adjacent to your seismic objective
horizon; you may have to flip the sign so that the higher RAD values
of the pseudo horizon will be up around 1.9 seconds and white data
(no anomaly) will be at 2.0 seconds. (see Fig. 2)
If the anomaly corresponds to the objective then you have
confirmation that your interpretation may be valid. If however,
there is no logical comparison between the seismic and the anomaly
then shift the RAD horizon up or down the seismic section until
something lines up. Perhaps there is a fault that matches the edge
of the RAD anomaly or a seismic doublet that could represent a
hydrocarbon charged channel sand that matches the anomaly.
Compare waveform changes or amplitude anomalies, any subtle
seismic attribute that may be significant to the RAD pseudo horizon;
then map it.
You should get the point by now. Use the RAD data to peruse the
entire seismic volume for unforeseen potential hydrocarbon zones.
You may be surprised as to where your next well should be drilled.
3D Seismic
Our value rated atmospheric RAD anomalies are indicators of
hydrocarbons at some unspecified depth. These anomalies may be
associated with the targeted geologic zones or they may be sourced
from another formation that has thus far been overlooked or ignored
completely. It is the interpreter’s responsibility to try and
determine a logical source for the RAD anomaly. (see Fig. 1)
Most 3-D surveys are shot to obtain data over a known target, a
producing formation, an exploration discovery or a specific
exploration objective. Of course, the seismic data covers a much
thicker geologic section than just the targeted zone(s). How many
times have we logged unexpected pay zone(s) while drilling to the
main objectives?
One method that is found to work for some entails the importation
of the RAD data, as grids, into the seismic 3-D interpretation
package. One geophysicist’s method is to scale the data to
something like 0-100 then convert it to a pseudo horizon. Display
the pseudo horizon on your seismic section, it will show up at zero
time. So if your target zone is at 2 seconds add 2000 to your horizon
and it will now show up at 2 seconds on the seismic line. The RAD
anomaly will then be shown adjacent to your seismic objective
horizon; you may have to flip the sign so that the higher RAD values
of the pseudo horizon will be up around 1.9 seconds and white data
(no anomaly) will be at 2.0 seconds. (see Fig. 2)
If the anomaly corresponds to the objective then you have
confirmation that your interpretation may be valid. If however,
there is no logical comparison between the seismic and the anomaly
then shift the RAD horizon up or down the seismic section until
something lines up. Perhaps there is a fault that matches the edge
of the RAD anomaly or a seismic doublet that could represent a
hydrocarbon charged channel sand that matches the anomaly.
Compare waveform changes or amplitude anomalies, any subtle
seismic attribute that may be significant to the RAD pseudo horizon;
then map it.
You should get the point by now. Use the RAD data to peruse the
entire seismic volume for unforeseen potential hydrocarbon zones.
You may be surprised as to where your next well should be drilled.
3D Seismic


 Reeves Technology Corporation
498 Curtis Road - Burleson, TX 76028
817-447-8056
samreeves@reevestech.com
Reeves Technology Corporation
498 Curtis Road - Burleson, TX 76028
817-447-8056
samreeves@reevestech.com

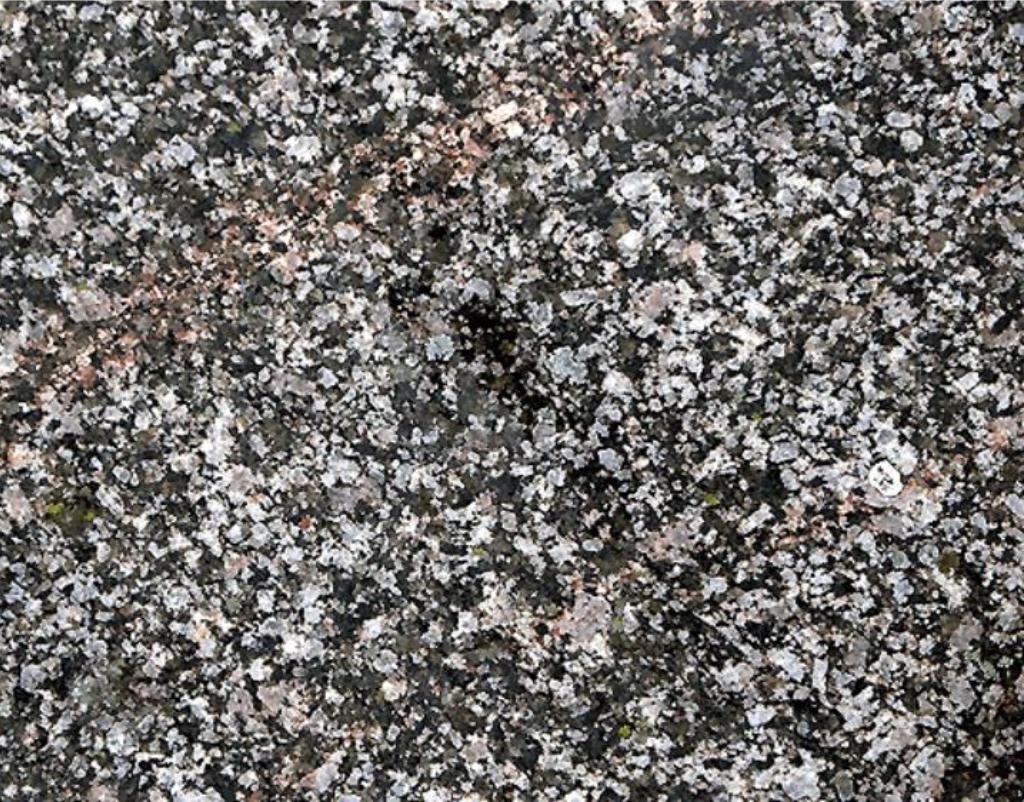
 click thumbnail to enlarge
Fig. 1*
click thumbnail to enlarge
Fig. 1*
 Fig. 2 (Interpreted)
click thumbnail to enlarge
*The image in Fig. 1 was
produced using a different color
scale than the one currently used
for RAD Maps.
*The image in Fig. 1 was
produced using a different color
scale than the one currently used
for RAD Maps.
Fig. 2 (Interpreted)
click thumbnail to enlarge
*The image in Fig. 1 was
produced using a different color
scale than the one currently used
for RAD Maps.
*The image in Fig. 1 was
produced using a different color
scale than the one currently used
for RAD Maps.
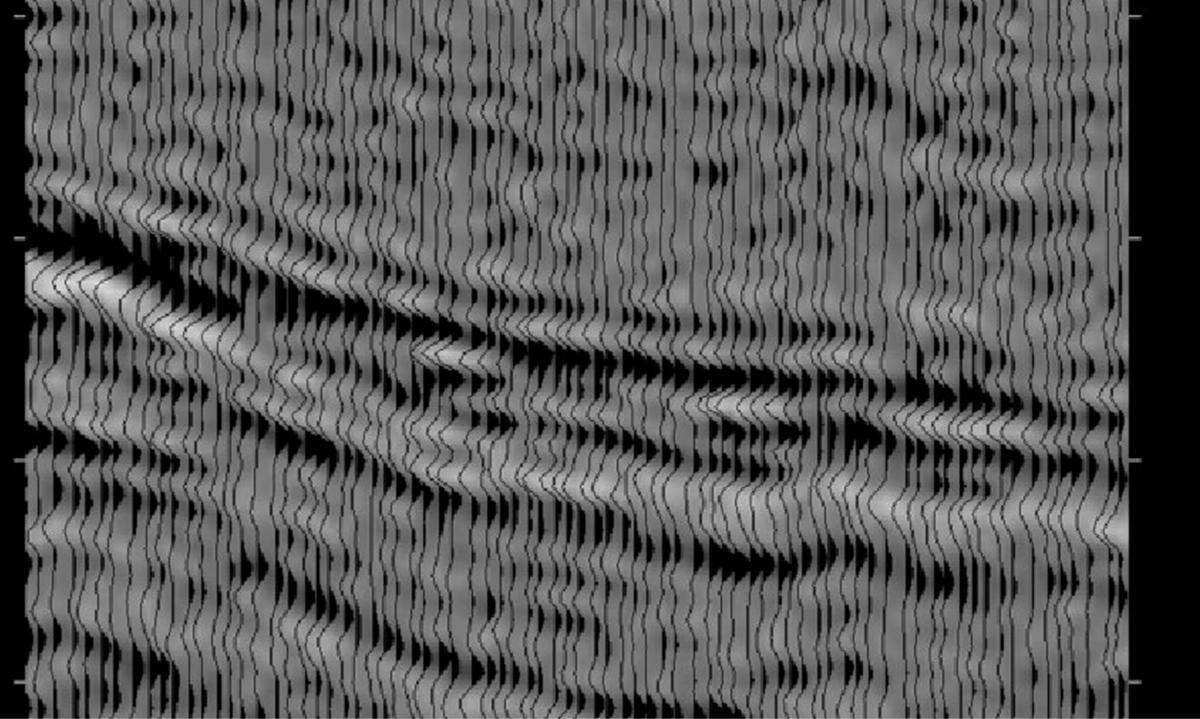 Fig. 2 (Raw Seismic)
click thumbnail to enlarge
Fig. 2 (Raw Seismic)
click thumbnail to enlarge


