


 Frequently Asked Questions


 Reeves Technology Corporation
498 Curtis Road - Burleson, TX 76028
817-447-8056
samreeves@reevestech.com
Reeves Technology Corporation
498 Curtis Road - Burleson, TX 76028
817-447-8056
samreeves@reevestech.com

 What is a RAD?
RAD (Reeves Acquired Data) is what we call a processed anomaly of
dense active areas of the fluorescence that indicates hydrocarbon
accumulations at some depth.
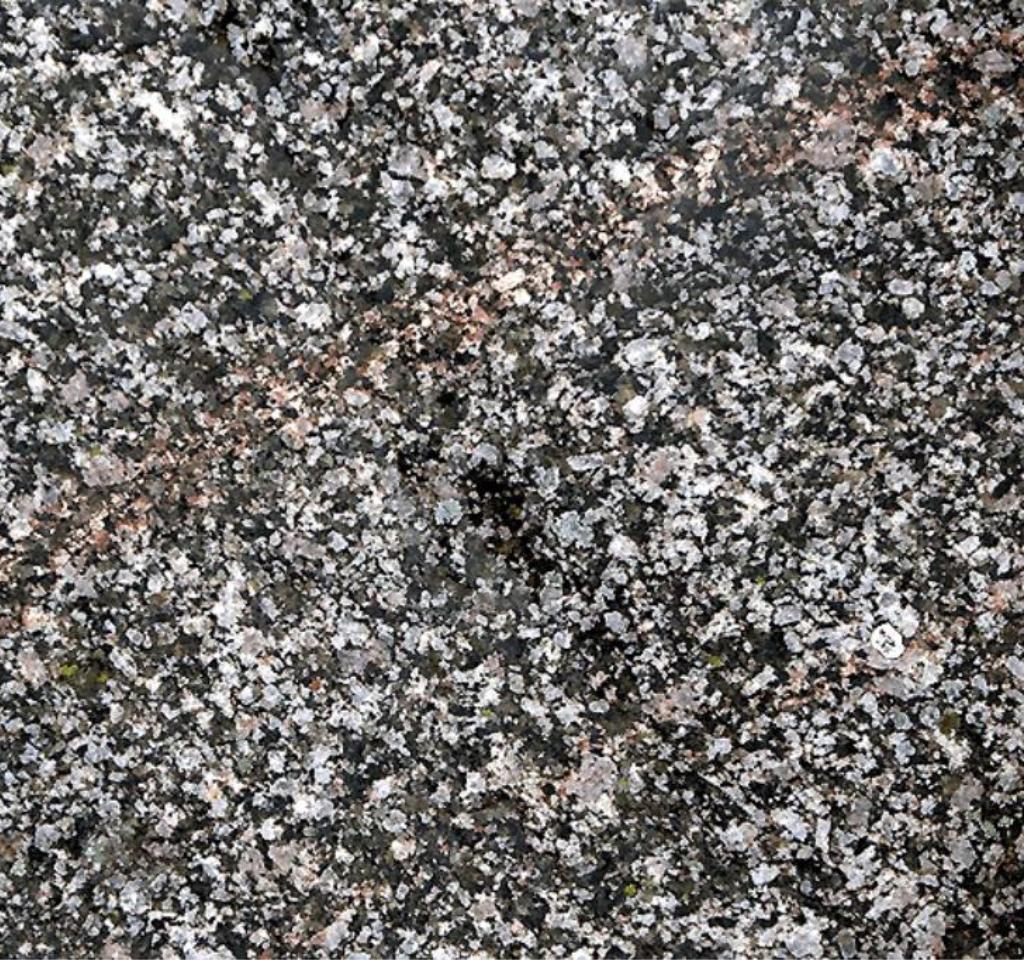
What is a RAD Map?
A RAD Map is the processed data in printed form combining all the
RADs gathered during data acquisition, layered with other standard
industry mapping features. (Fig. 1)
When and where is it best to use a RAD Map?
The ideal situation is to use a RAD Map first to lead the way for
other geological and geophysical procedures, however it will be
beneficial during any phase of the exploration process.
How much does a RAD Map cost for my acreage?
Cost is on a sliding scale per acre basis with a minimum charge of
$5000 + mobilization fee or a day rate of $100,000 + mobilization
fee.
How long does it take to record and process an area?
The size of the area, location and topography determine the
amount of time it takes to record raw data; then it is approximately
10-21 days from data acquisition to delivery of the RAD Map.
Is there a specific time of day that is better for data acquisition?
Yes, the E-Tide program gives us the optimum window, which
includes the best hours of the day, for data acquisition in any given
area.
How can a RAD Map work with seismic?
If used prior to running seismic,a RAD Map will give you a pattern
for laying out the seismic lines over the highest RAD value area(s)
for more targeted zone identification.
Can a RAD Map help with waterfloods?
Yes, the RADs will increase in value where the oil has accumulated.
If you record the DHA before pressuring up and again after pressure
is achieved you will get a picture of the migration.
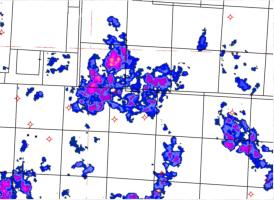
Do you have an inventory of RAD Maps?
Yes, we have over 200 million acres of RAD Maps within the lower
48 states. (Fig. 2)
Do you have prospective areas with high value RADs?
Yes, we keep an inventory of RAD Mapped areas ready to lease and
drill.
What is a RAD?
RAD (Reeves Acquired Data) is what we call a processed anomaly of
dense active areas of the fluorescence that indicates hydrocarbon
accumulations at some depth.
What is a RAD Map?
A RAD Map is the processed data in printed form combining all the
RADs gathered during data acquisition, layered with other standard
industry mapping features. (Fig. 1)
When and where is it best to use a RAD Map?
The ideal situation is to use a RAD Map first to lead the way for
other geological and geophysical procedures, however it will be
beneficial during any phase of the exploration process.
How much does a RAD Map cost for my acreage?
Cost is on a sliding scale per acre basis with a minimum charge of
$5000 + mobilization fee or a day rate of $100,000 + mobilization
fee.
How long does it take to record and process an area?
The size of the area, location and topography determine the
amount of time it takes to record raw data; then it is approximately
10-21 days from data acquisition to delivery of the RAD Map.
Is there a specific time of day that is better for data acquisition?
Yes, the E-Tide program gives us the optimum window, which
includes the best hours of the day, for data acquisition in any given
area.
How can a RAD Map work with seismic?
If used prior to running seismic,a RAD Map will give you a pattern
for laying out the seismic lines over the highest RAD value area(s)
for more targeted zone identification.
Can a RAD Map help with waterfloods?
Yes, the RADs will increase in value where the oil has accumulated.
If you record the DHA before pressuring up and again after pressure
is achieved you will get a picture of the migration.
Do you have an inventory of RAD Maps?
Yes, we have over 200 million acres of RAD Maps within the lower
48 states. (Fig. 2)
Do you have prospective areas with high value RADs?
Yes, we keep an inventory of RAD Mapped areas ready to lease and
drill.
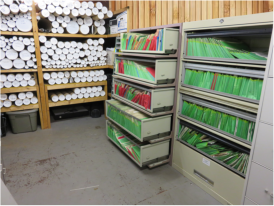


 Fig. 1
This King Co. Texas RAD Map shows
dry holes that could have been
avoided
Fig. 2
A small portion of our 200 million
acre inventory of RAD Maps and
prospect data
Fig. 1
This King Co. Texas RAD Map shows
dry holes that could have been
avoided
Fig. 2
A small portion of our 200 million
acre inventory of RAD Maps and
prospect data


